The method
Each uncertain input is described by a probability distribution (normal, triangular, lognormal, uniform…). The model is computed thousands of times, drawing a value for each input every time.
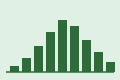
The result is a distribution: mean, percentiles (P10, P50, P90), probability of exceeding a threshold. Sensitivity indices show which inputs drive the uncertainty.
The method applies to many models: project cost and schedule, financial losses, doses or concentrations, reliability. GUM Supplement 1 (JCGM 101:2008) describes it for measurement uncertainty, and ISO/IEC 31010 lists it among risk assessment techniques.
When to use it
- When several inputs are uncertain and a worst-case estimate would be too pessimistic or uninformative.
- To estimate a probability of exceedance (budget, schedule, regulatory threshold).
- To identify the inputs whose uncertainty should be reduced first.
Watch out for
- The choice of distributions and their bounds often matters more than the number of iterations.
- Ignoring correlation between inputs can badly underestimate extremes.
- Simulation does not fix a wrong model: validate it first on simple cases.
Steps
- Write the model linking inputs to the result.
- Choose a distribution for each uncertain input, from data or documented expert judgement.
- Define correlations between inputs where they exist.
- Run enough iterations and check convergence.
- Read the output distribution, percentiles and sensitivities; report assumptions with the results.
Monte Carlo simulation software
List from the Aurorisk catalogue, links checked on 2026-09-26. Confirmed free access is listed first; unknown information is labelled.
| Tool | Source · licence · access | Scope | Description |
|---|---|---|---|
| Aurorisk — Monte Carlo | Free for teaching | France | Teaching tool: probability-distribution inputs, equation, results as histogram, cumulative curve (P10/P50/P90) and tornado diagram. Not validated, not for real studies. |
| OpenTURNS ↗ | Association or foundationOpen sourceFree | France | Python library for uncertainty and reliability (EDF, Airbus, Phimeca). |
| SALib ↗ | Open sourceFree | International | Sensitivity analysis in Python. |
| Yasai ↗ | Open sourceFree | United States | Simple Excel Monte Carlo add-in for teaching. |
| @RISK (Lumivero) ↗ | Commercial publisher | International | Reference Excel add-in. |
| ModelRisk (Vose) ↗ | Commercial publisher | International | Quantitative risk simulation. |
| Oracle Crystal Ball ↗ | Commercial publisher | International | Forecasting and simulation in Excel. |
Standards and references
- ISO/IEC 31010 — Simulation de Monte-Carlo
- JCGM 101:2008 — Supplément 1 au GUM (propagation par Monte-Carlo)